05:00
Welcome to Stat 220
Day 01
Prof Amanda Luby
Carleton College
Stat 220 - Fall 2026
Intros
About me
- Third year at Carleton!
- Taught at Swarthmore for 5 years before moving here
- PhD in Statistics & Data Science from Carnegie Mellon University
- Grew up in Minnesota, went to St Ben’s as an undergrad
- When I’m not writing R code, making graphs, or chasing after my toddler, I like to read and have been trying to do more fiber crafts

Proud of/ Nervous about
In groups of 3-4
- Introduce yourselves: name, year, academic interest, personal interest
- Share a bit about why you’re taking this class
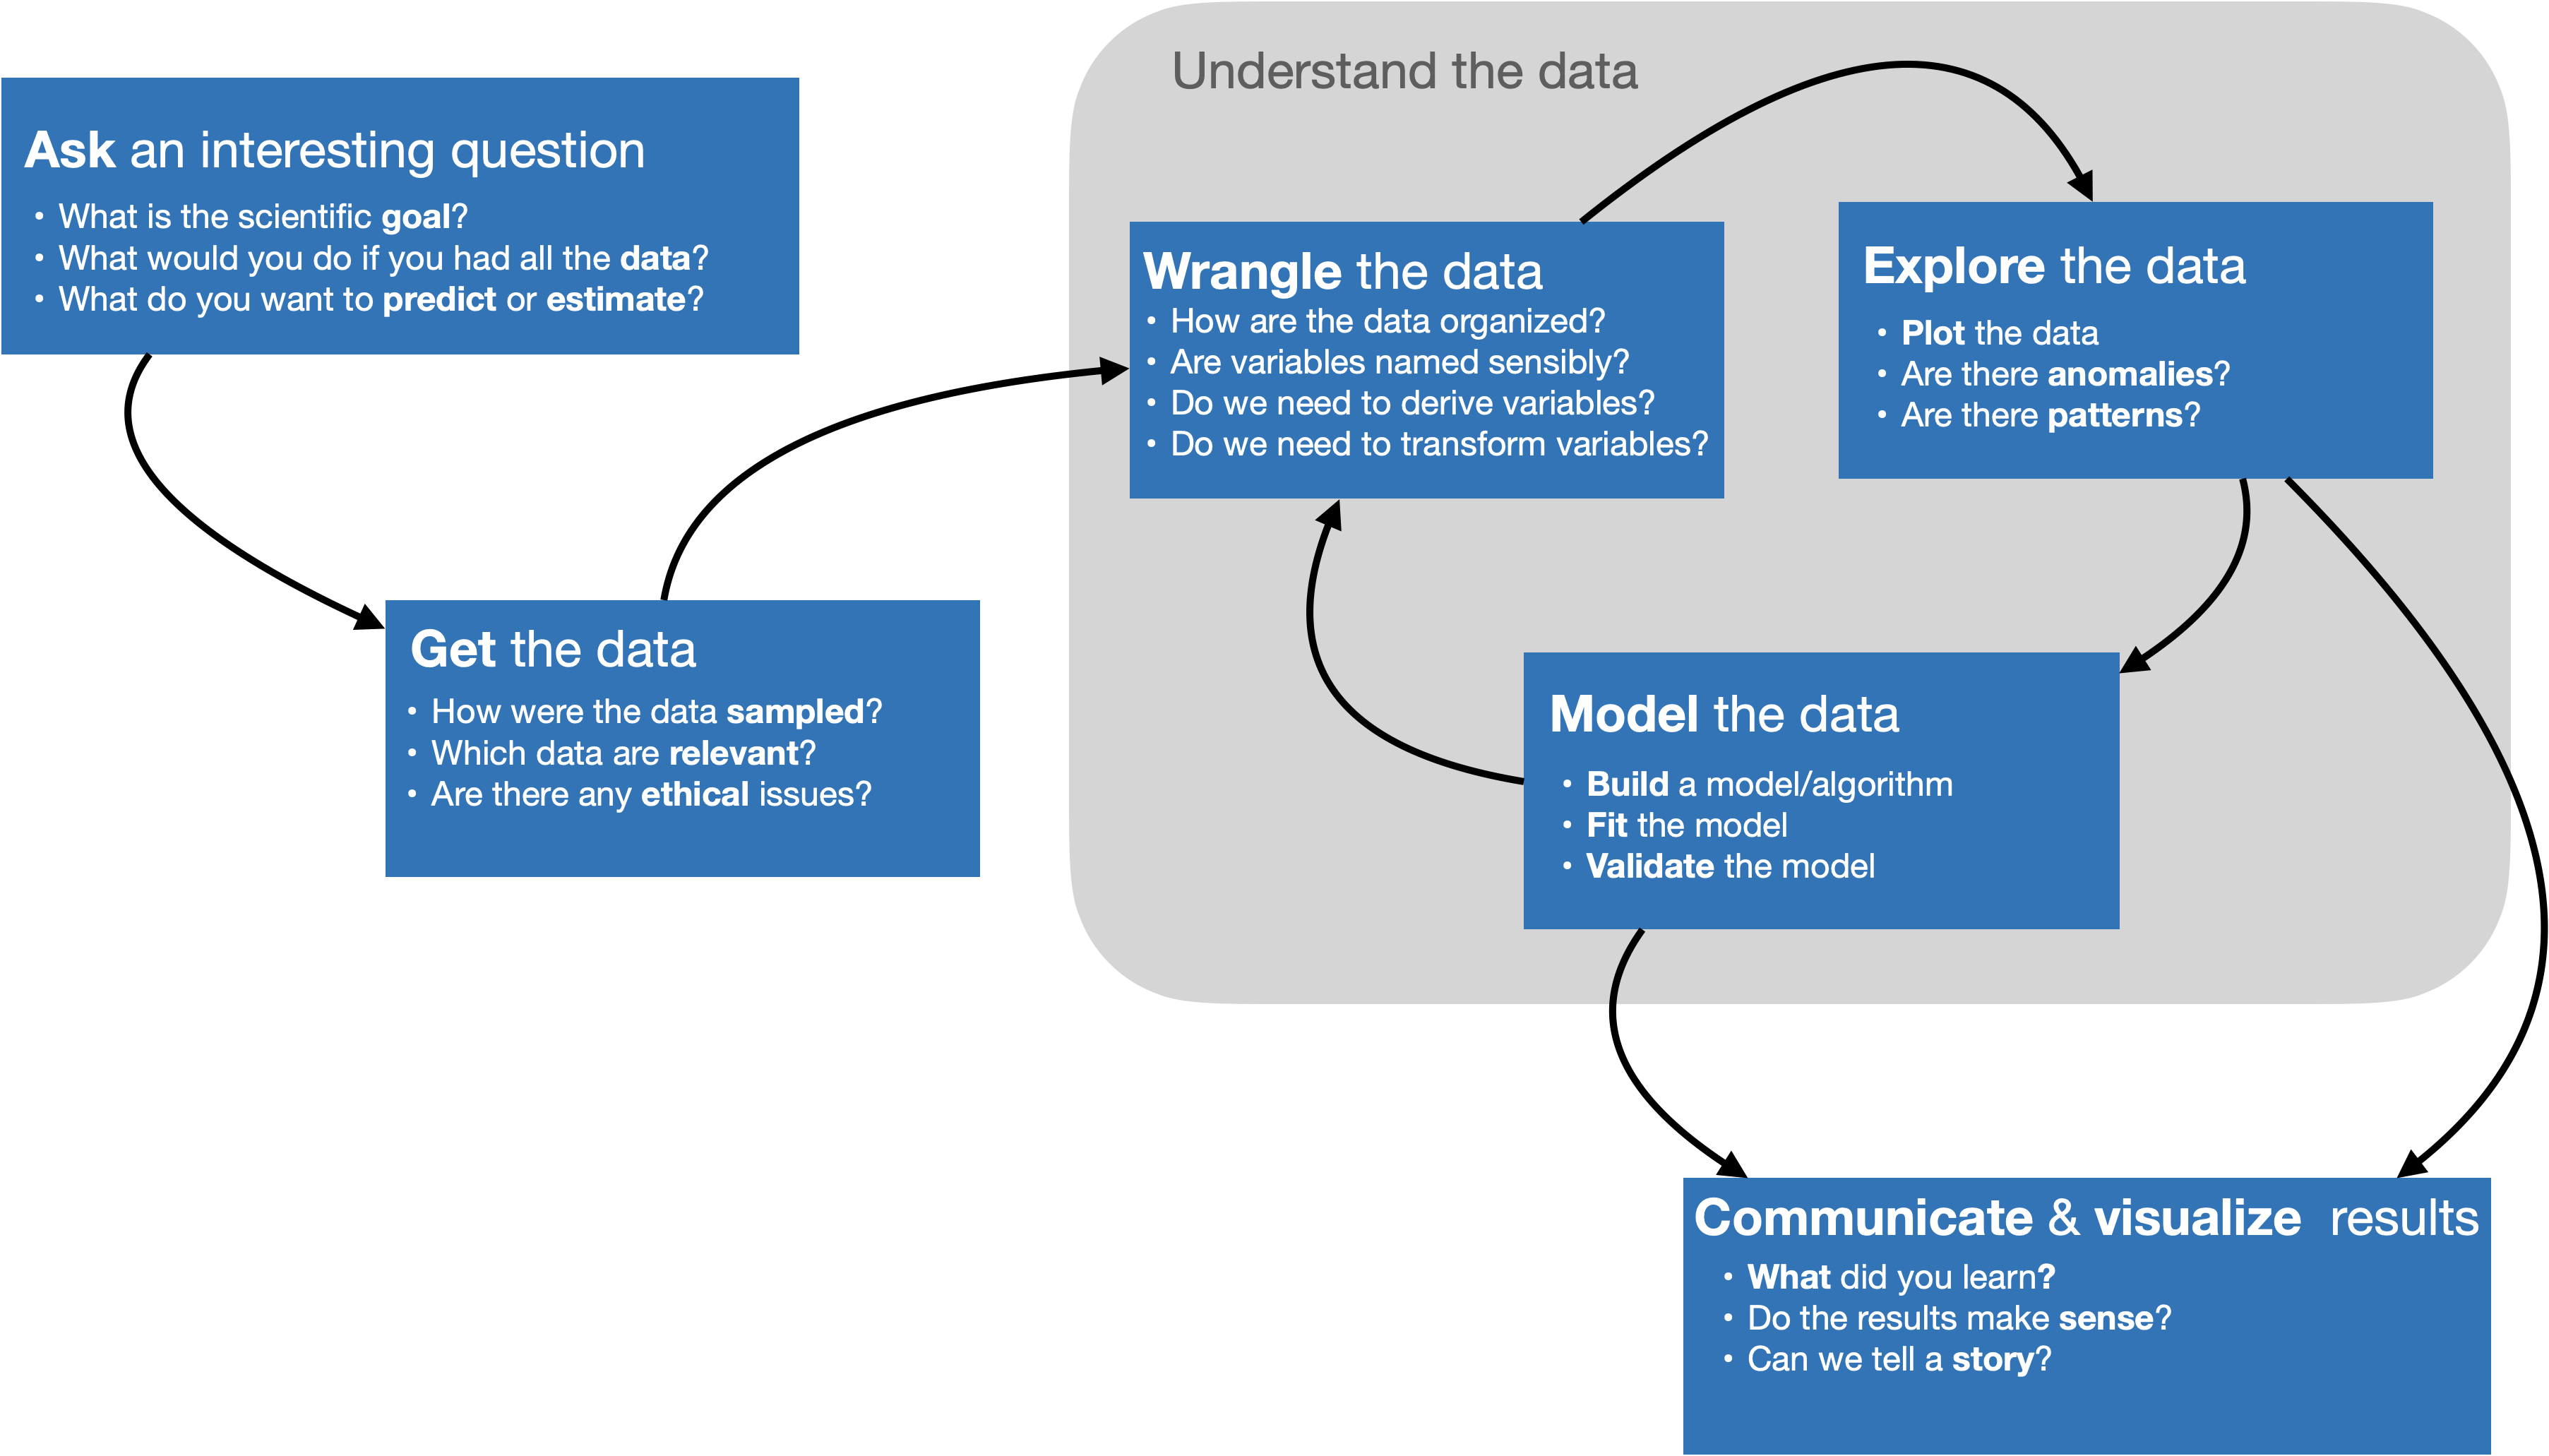
What is this class about?
- Develop research questions that can be answered with data
- Acquire data from multiple sources
- Wrangle common types of data
- Visualize data to provide insight
- Communicate your findings
- Document your code and collaborate on coding projects
Sneak peek: class survey data
# A tibble: 10 × 4
   class_year  tabs northfield_food     googled
   <chr>      <dbl> <chr>               <chr>
 1 Senior        10 Gran Plaza          "hateno village botw"
 2 Senior        48 Hogan Brothers      "What is rstudio"
 3 Senior         6 Home kitchen        "\"is there really visual learner resea…
 4 Junior         2 Tanzenwald          "Are refried beans vegetarian?"
 5 Junior        58 Gran Plaza          "Stridor definition"
 6 Junior         9 Culver's            "Github"
 7 Sophomore     22 Desi Diner          "Monty Python and the Holy Grail"
 8 Sophomore      6 Tinn's              "tv at target"
 9 Junior         8 At the coop!        "US open winner"
10 Junior        13 Burton or the Blast "Family Fare Rewards 😂 (my rewards thin…
You took a survey

Google saved your responses in a sheet

I read your data into R, cleaned it, and saved it as a CSV

Multiple choice question where you could only pick one option
What class year are you?
- First year
- Sophomore
- Junior
- Senior
Visualize
Code
survey |>
  count(class_year) |>
  mutate(prop = n/sum(n)) |>
  ggplot(aes(y = class_year, x = prop, fill = class_year)) +
  geom_col(show.legend = FALSE) +
  scale_x_continuous(labels = scales::percent_format(accuracy = 1), breaks = c(0, .1, .2, .3, .4, .5)) +
  labs(
    title = "Class year among Stat220 Students",
    y = "",
    x = "Proportion",
    caption = "Self-reported data collected from Stat220 students"
  ) +
  scale_fill_viridis_d(end = .75, option = "plasma")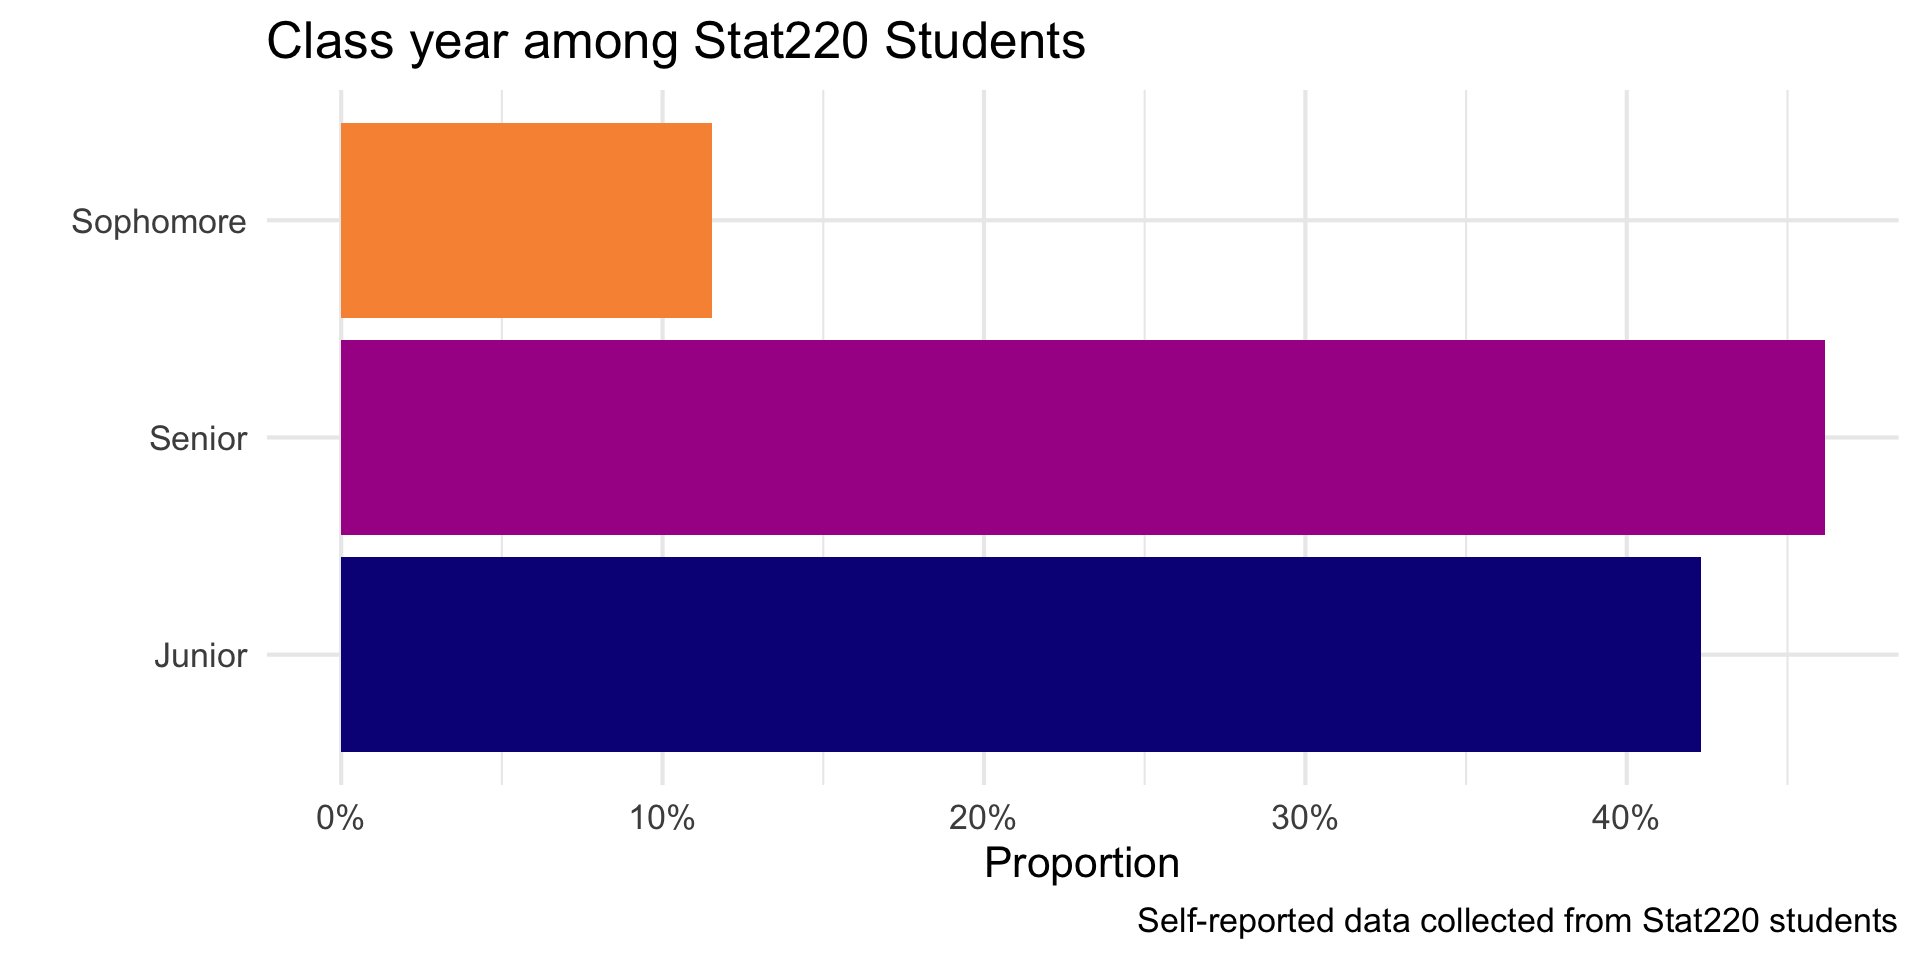
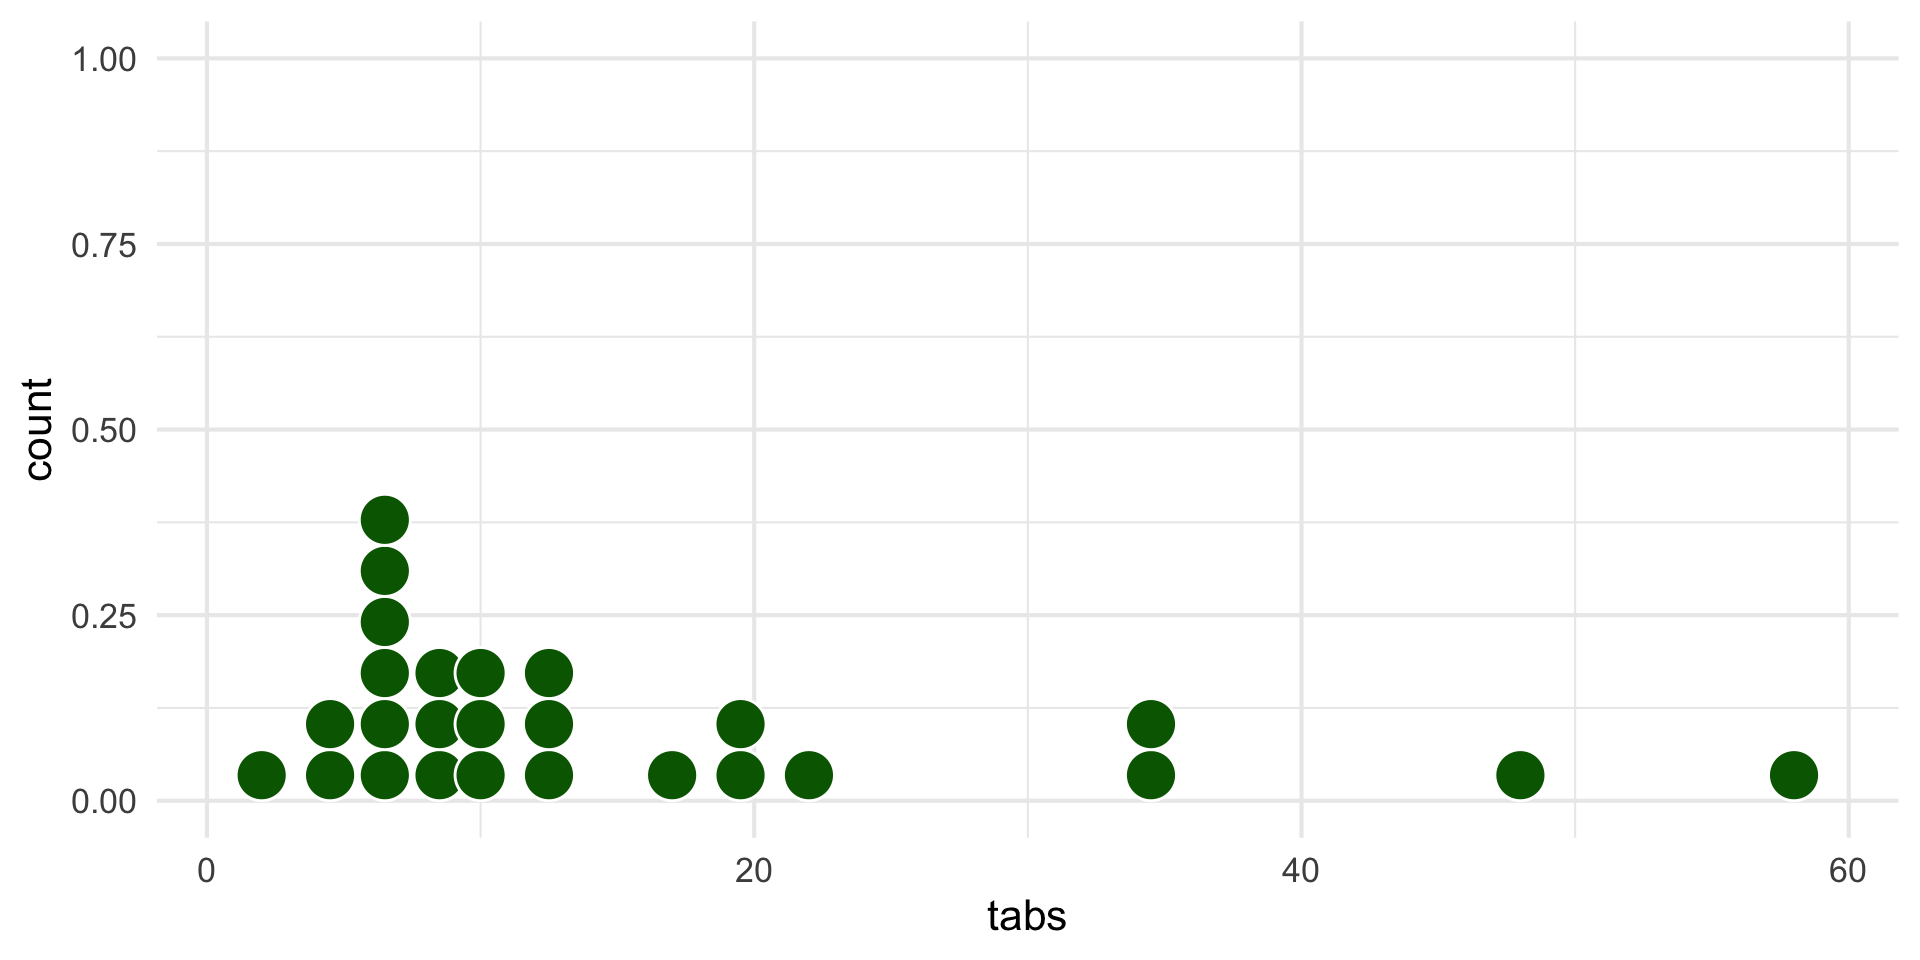
Question where you could enter a number
How many browser tabs do you currently have open?
Visualize
Open-ended question
Where can you find the best food in Northfield?
 [1] "Hogan Brothers"
 [2] "Hogan Bros!!!"
 [3] "Tin Tea!"
 [4] "Tinn's"
 [5] "Not the dining halls"
 [6] "Desi Diner"
 [7] "Tanzenwald"
 [8] "Burton or the Blast"
 [9] "Desi Diner is always the best but Hideaway is lowkey slept on."
[10] "Desi Diner"
[11] "Home kitchen"
[12] "At the coop!"
[13] "Gran Plaza"
[14] "desi diner"
[15] "I wouldn't know"
[16] "Toyko Grill, Culver's"
[17] "Desi Diner"
[18] "Hogan Brothers"
[19] "Culver's"
[20] "El Triunfo"
[21] "Gran Plaza"
[22] "Gran Plaza"
[23] "Carbones"
[24] "Downtown"
[25] "Desi Diner"
[26] "Tanzenwald"
Visualize
Code
survey |>
  count(northfield_food) |>
  mutate(prop = n/sum(n)) |>
  ggplot(aes(y = northfield_food, x = prop, fill = northfield_food)) +
  geom_col(show.legend = FALSE) +
  scale_x_continuous(labels = percent_format(accuracy = 1), breaks = c(0, .1, .2, .3, .4, .5)) +
  labs(
    title = "Where can you find the best food in Northfield?",
    y = "",
    x = "Proportion",
    caption = "Self-reported data collected from Stat220 student"
  ) +
  scale_fill_viridis_d(end = .75, option = "plasma")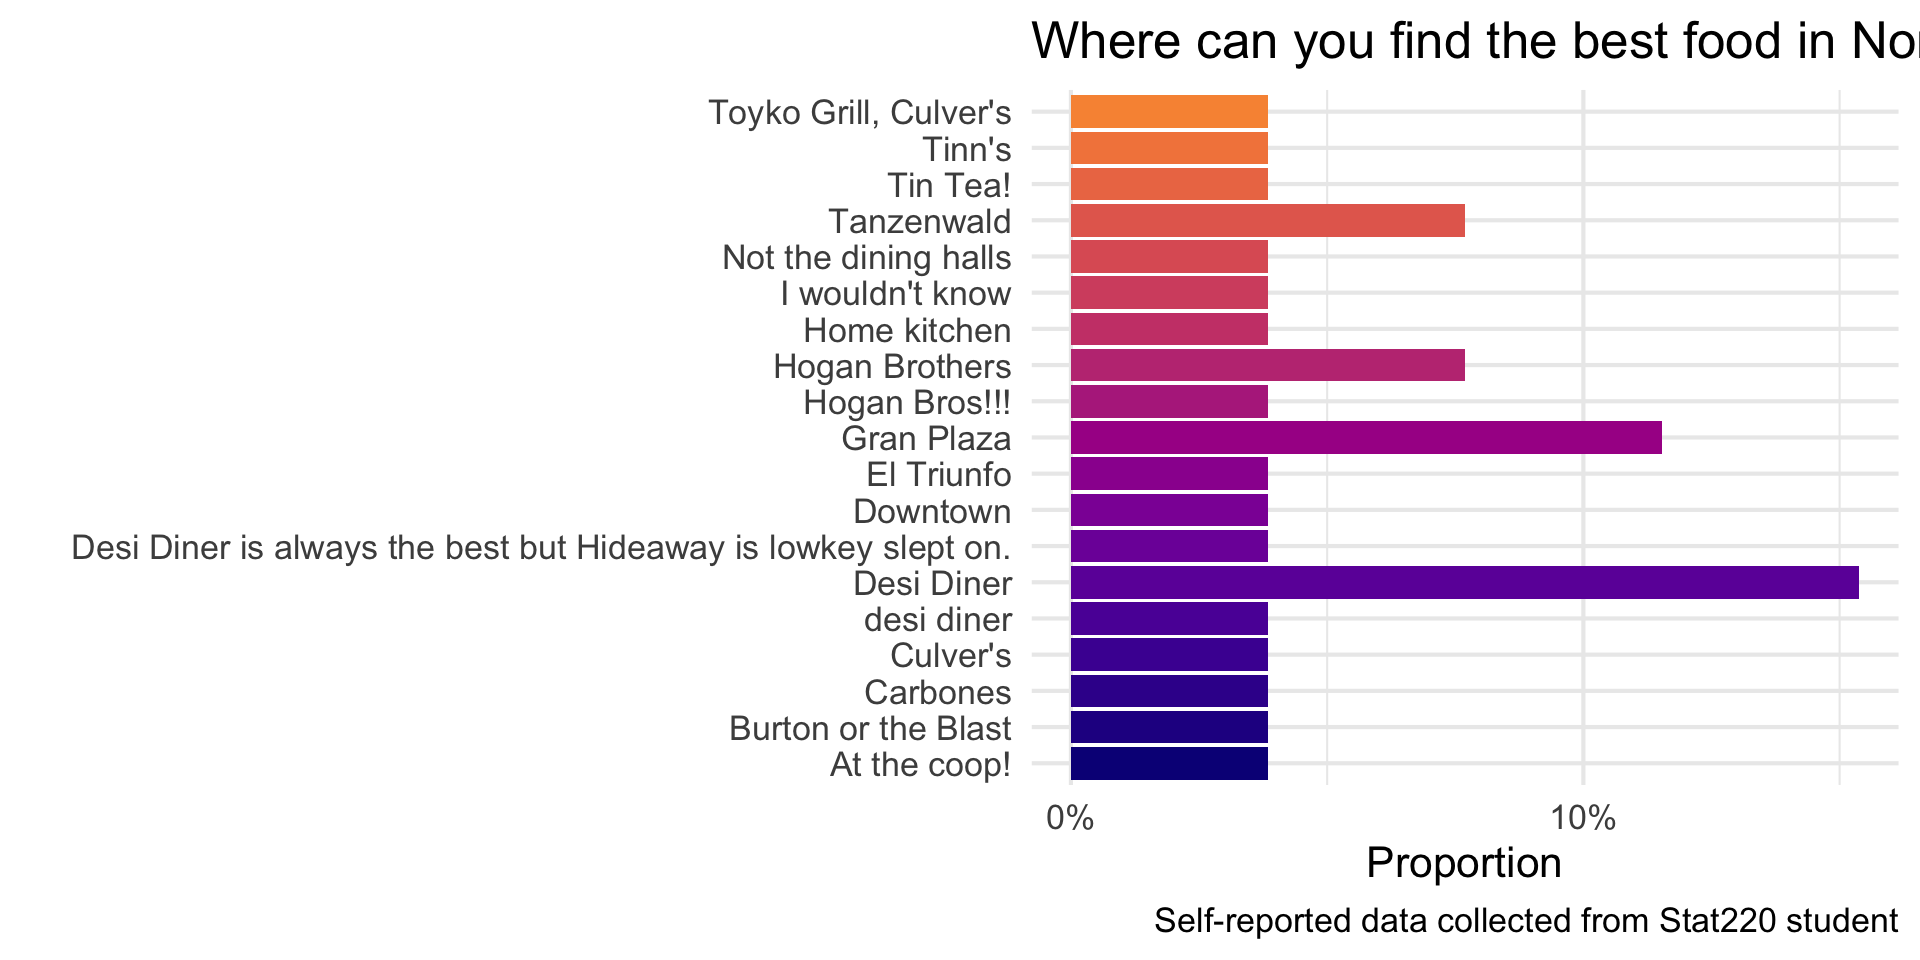
Open-ended question with even less structure
What was the last thing you googled?
 [1] "can a nissan rogue use ethonal gas?"
 [2] "\"What does GI stand for?\" (In a military sense)"
 [3] "GitHub"
 [4] "tv at target"
 [5] NA
 [6] "GitHub!"
 [7] "usa women's basketball"
 [8] "Family Fare Rewards 😂 (my rewards thing was broken...)"
 [9] "Carleton Moodle"
[10] "github.com/dashboard"
[11] "\"is there really visual learner research\""
[12] "US open winner"
[13] "hateno village botw"
[14] "Googling how to spell minneapolis :("
[15] "I went to google when the LDC cafeteria opened for dinner yesterday"
[16] "Toyko"
[17] "Monty Python and the Holy Grail"
[18] "What is rstudio"
[19] "Github"
[20] "minnesota frost season"
[21] "Carleton College stats courses"
[22] "Stridor definition"
[23] "Howard Cross"
[24] "Carleton special Monday convo schedule"
[25] "carleton schedule"
[26] "Are refried beans vegetarian?"
What is this class all about?
Wait – can’t AI just do this?
AI is a tool. It still needs a skilled operator
- Generative AI can write code, summarize data, and produce a plot in seconds. It can make those plots polished and give you some really confident insights
- It cannot tell you whether that code, summary, or plot is actually right
- You have to know what to ask for, and be able to recognize when the answer is wrong. These skills are what we’ll work on building in this course
A recurring theme from hiring managers:
“We want people who know how to use AI but who understand what it’s doing, and catch it when it’s wrong.”
What AI can’t do for you
- Communicating results is a human skill
- Formal: writing up findings for an audience who will act on them, giving a prepared presentation
- Informal: explaining your reasoning out loud, defending a choice, asking for clarification, catching a teammate’s mistake in conversation
- AI can help you say something faster. It can’t decide what’s worth saying, or who you’re saying it to
“School is a gym, not a job”
A cautionary tale
Prompt: I need to find the percent of my class that gets enough sleep (7+ hours a night). My data is in a data frame with a column for “student” which has a student ID, and a column for “sleep_hours” which has their response to this question. can you give me R code to do this?
So… what actually happened?
Why R?
And the second reason, which is both a huge strength of R and a bit of a weakness, is that R is not just a programming language. It was designed from day 1 to be an environment that can do data analysis. So, compared to the other options like Python, you can get up and running in R doing data science, learning much, much less about programming to get started. And that generally makes it like easier to get up and running if you don’t have formal training in computer science or software engineering.
-Hadley Wickham, Advice to Young (and Old) Programmers: A Conversation with Hadley Wickham

It’s easy when you start out programming to get really frustrated and think, “Oh it’s me, I’m really stupid,” or, “I’m not made out to program.” But, that is absolutely not the case. Everyone gets frustrated. I still get frustrated occasionally when writing R code. It’s just a natural part of programming. So, it happens to everyone and gets less and less over time. Don’t blame yourself. Just take a break, do something fun, and then come back and try again later.
Maize Server
Browser based RStudio instance(s) provided by Carleton
Requires internet connection to access
Provides consistency in hardware and software environments
Local R installations are also great! We will all download R by the end of the course. If you already have one, you should use it. You may need to install packages as we go.
A first example: College Costs & Career Pay
On your own:
- Log into the maize server: <maize.mathcs.carleton.edu>
- Follow the directions at https://stat220-f26.github.io/computing/rstudio-stat220 to create an “activities” folder
- Open
01-college-tuition-payfrom https://stat220-f26.github.io, and follow the directions to open the file in Rstudio - Skim the file without running any code:
- Where is the code?
- Where is the narrative?
- Run each code chunk in order. What does this analysis do?
10:00
What steps went into this analysis?
- Recording the original data
- Reading data directly from the web
- Combining multiple datasets into one
- Data cleaning: filtering, creating new columns, grouping, summarizing
- Making a graph
- Fitting a smooth line model
Your turn:
With your neighbor(s):
Choose two other states to compare to Minnesota’s tuition and career pay.
What did you learn?
04:00
Syllabus highlights
Read the full syllabus by next class
Course website
- access slides
- see schedule
Course github organization
- access repositories for homework and projects
Office hours (tentative)
| Day | Time | Type | Location |
|---|---|---|---|
| Monday | 3-4 | Drop-in | CMC 307 |
| Tuesday | 10:30-11:30 | Drop-in | CMC 307 |
| Wednesday | 2-3 | Drop-in | CMC 307 |
| Friday | 11:30-12:30 | Drop-in | CMC 307 |
Where is Amanda this term?
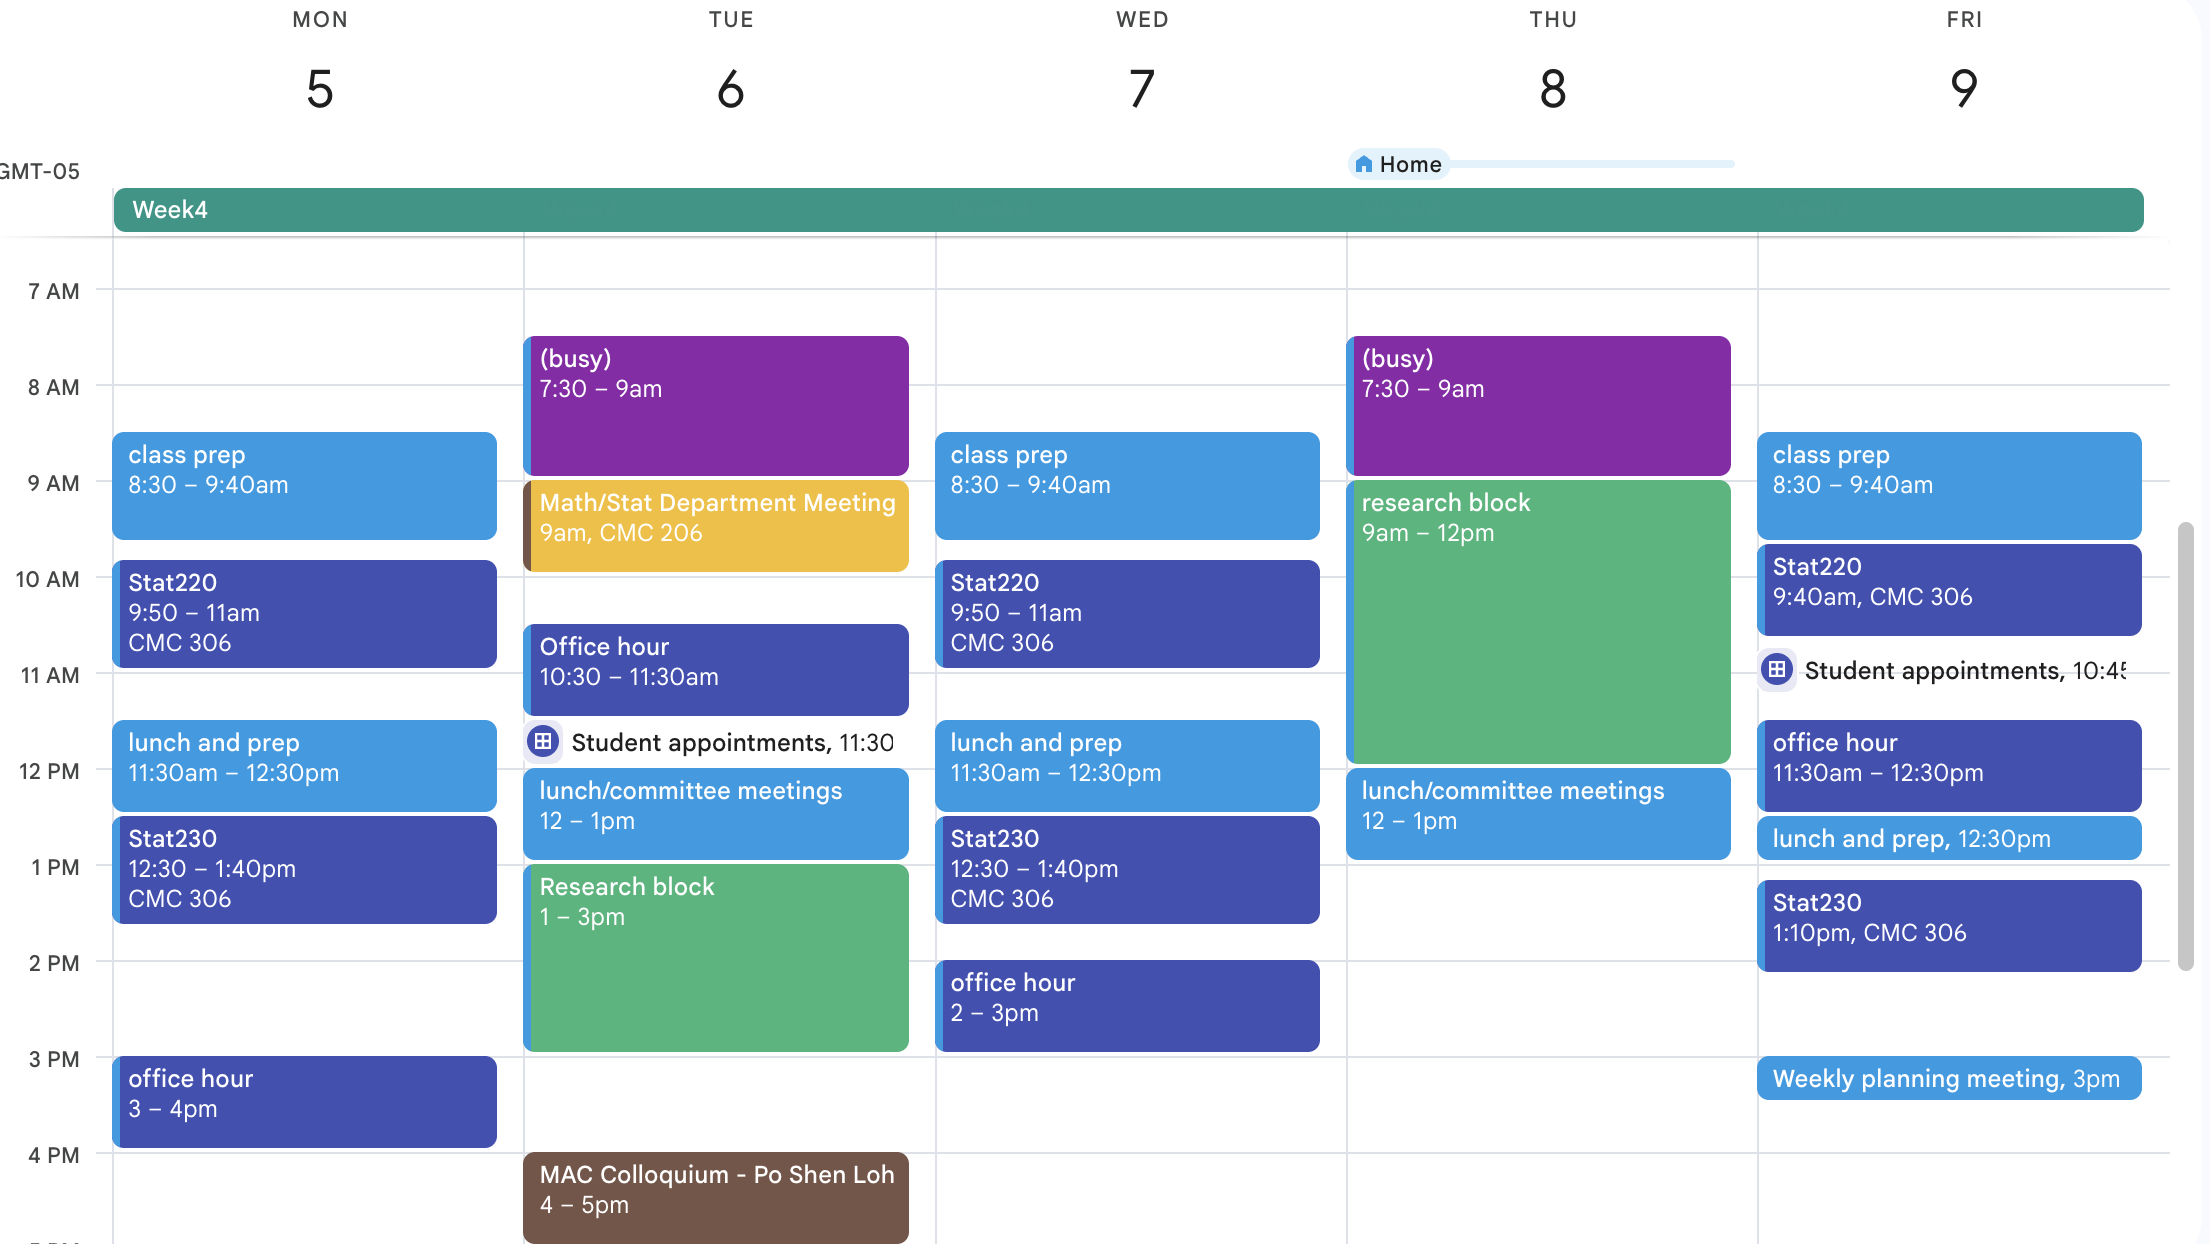
What will you do in this course?
Graded work:
- Homework
- Lab Quizzes
- Portfolio Projects
- Final Project
Ungraded work:
- Daily prep for class: read/watch/review/try
- In-class exercises
- Engagement in small and large group discussions
What will a typical day/week look like?
Before class:
- Watch a video or read a chapter
- Come with questions
- Be prepared to try what was covered
In class:
- Mini lecture
- Sometimes review
- Sometimes new
- Hands-on coding in R
After class:
- Finish in-class exercises
- Work on homework and portfolio projects
Grading system
Homework and lab quiz problems will be graded as successful, half credit, or not successful. Projects will be graded as excellent, successful, or not successful.
To earn a course grade, you must meet all of the requirements in a given row:
| Homework Problems | Lab Quiz Problems | Portfolio Projects (3 total) | Final Project | |
|---|---|---|---|---|
| A | 85% | 88% | 2 Excellent + 1 Successful | Excellent |
| B | 75% | 78% | 3 Successful | Successful |
| C | 65% | 68% | 2 Successful | Successful |
| D | 55% | 50% | 1 Successful | Successful |
“+” and “-” grades are determined by partially meeting the requirements in a given row.
Note: I expect daily attendance and participation. Missing >5 class meetings or consistent issues with being on-task will result in a 1/3 grade deduction.
Benefits
- You decide what grade you’re aiming for, and what you have to do to earn it
- Clear guidelines for “successful” and “excellent” grades on projects
- Opportunity to revise and resubmit
Possible drawbacks
- No traditional partial credit!
- Half-credit is for completed and mostly correct
- Revisions take time
- Categories don’t “average out”
Tokens
- You have four tokens to use throughout the term
You can turn in a token for:
- A 72-hour extension on a homework assignment
- A revision on a portfolio project (you can revise the same project multiple times, but it costs a token each time)
- A retake of a quiz
Tokens may not be used for final project-related assignments
Collaboration policy
| Collaboration Allowed | |
|---|---|
| Homework Problems | You are allowed and encouraged to collaborate on homework. You may also use outside resources, but your submitted work must be your own and reflect your own understanding . |
| Lab Quiz Problems | No collaboration is allowed at all . You may use your own notes for resubmissions, but should not use outside resources. |
| Portfolio Projects | You are expected to collaborate with your group, but cannot rely on external sources other than to help motivate the questions or provide other background information. Getting answers on significant parts of solutions from outside resources is not allowed. |
| Final Project | You are expected to collaborate with your group, but cannot rely on external sources other than to help motivate the questions or provide other background information. Any outside resources should be properly cited. |
Use of generative AI
Two guiding principles shaped this policy:
(1) Cognitive dimension: working with AI should not reduce your ability to think clearly. AI should facilitate — rather than hinder — learning.
(2) Ethical dimension: if you use AI, you should be transparent about it and make sure it aligns with academic integrity.
Use of generative AI, in practice
✅ Coding & debugging help – but only after you’ve attempted the problem yourself
❌ Homework, quiz, and project prompts – never type these directly into an AI tool
❌ Copy/paste in or out – never paste course materials into an LLM, and never paste LLM output into your work
Copying, paraphrasing, summarizing, or submitting AI-generated work as your own without attribution is academic dishonesty
Protecting your work — and mine
No recording lectures (e.g. Otter.ai) or generating transcripts/study notes from audio or video (unless an official accomodation from the student disability office!)
No uploading course materials (slides, prompts, notes) to AI tools or homework-help sites (e.g. Chegg)
Not sure if something’s OK? Ask (and always acknowledge any AI help you use)
Suspected violations are handled by the Provost’s Office
GitHub
https://github.com/stat220-f26
GitHub organization for the course
All of your work and your membership (enrollment) in the organization is private
Each assignment is a private repo on GitHub, I distribute the assignments on GitHub.
You will work on your assignment, then “render ➡️ commit ✅ push ⤴️”
You’ll then be able to submit your PDF via gradescope
Fill out the Welcome Survey for collection of your account names, later this week you will be invited to the course organization.
Username advice
in case you don’t yet have a GitHub account…
Some brief advice about selecting your account names (particularly for GitHub),
Incorporate your actual name! People like to know who they’re dealing with and makes your username easier for people to guess or remember
Reuse your username from other contexts, e.g., your Carleton email or gmail account
Pick a username you will be comfortable revealing to your future boss
Shorter is better than longer, but be as unique as possible
Make it timeless. Avoid highlighting your current university, employer, or place of residence
Wrap up
Your tasks before next class
Create a GitHub account if you don’t have one
Complete the welcome survey if you haven’t already
Join the Ed discussion board and respond to the “in class” post from today
Read the syllabus and pass syllabus quiz
Make sure you can log in to the maize server or update your local R/RStudio versions
Complete the readings for next class